A Bullish Week Teases 20% Recovery For TRX Price
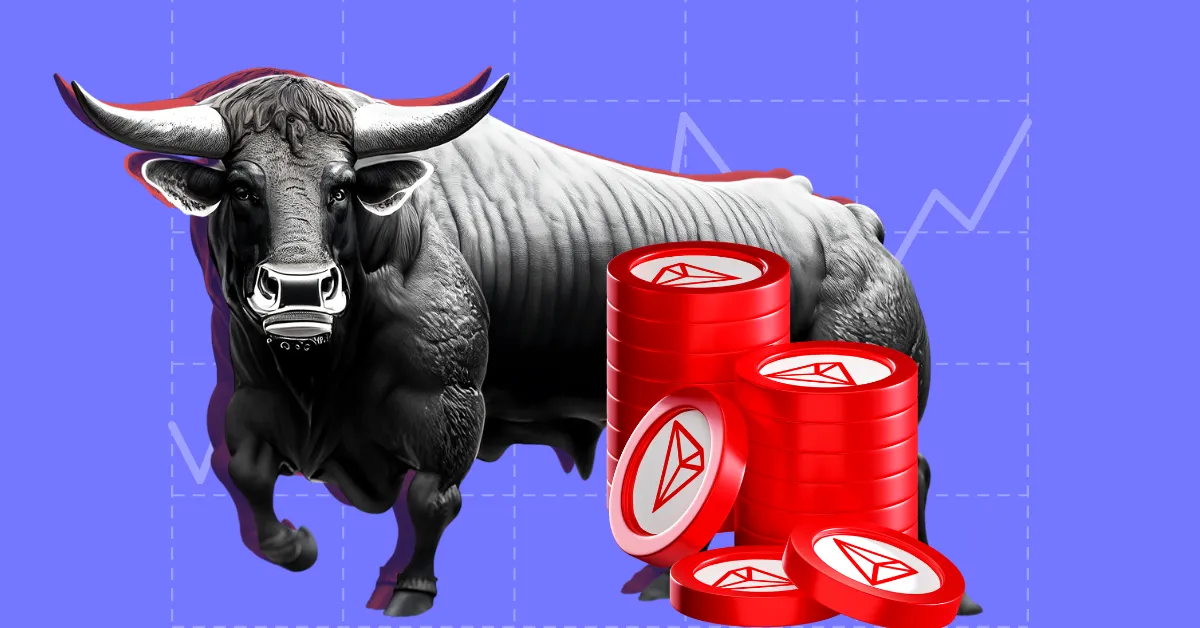
With the massive broader market correction, the TRX price action displays a pullback phase, testing the psychological mark of $0.10. However, the underlying demand, coupled with multiple bullish catalysts, led to a positive turnaround.
As the buying pressure grows and the general market sentiment improves, the Tron token value projects a potential surge. With a chance of hitting $0.20, our TRX price prediction predicts a prolonged uptrend to hit $1 in 2024.
Trend Reversal Finds Momentum
With a bearish reversal from the $0.1433 resistance, the TRX price fails to surpass the May 2021 peak levels. A 20% pullback with multiple weekly bearish candles drops the market value to almost $0.10.
However, the solid demand at the psychological mark of $0.10 and the prevailing uptrend create a buy-the-dip perception for TRON. Further, the 61.80% Fibonacci level and the long coming support trendline increases the bullish influence at lower levels.
Currently, the TRX price trades at $0.1184 with a weekly return of 6.28%, creating a bullish engulfing candle. Further, the price action reflects a morning star pattern formation at a crucial area of interest (AOI), increasing bullish reversal chances.
Also Check Out : Near Protocol Price Soars As AI Hype Rises! NEAR To Hit $10 Soon?
Technical Indicators:
RSI Indicator: The weekly RSI line showcases a bullish turnaround from the halfway line and reflects a boost in underlying bullishness.
MACD: The bearish crossover in the MACD and signal lines are turning lateral as the buying pressure resurfaces. This increases the chances of a potential bullish crossover. The declining intensity of the bearish histograms bolsters this thesis.
Will TRX Price Reach $0.20?
As the buyers remain dominant above the psychological mark of $0.10, the reversal rally projects a high likelihood of a jump to $0.15. Sustaining the bullish momentum, the uptrend can reach the $0.20 mark.
Conversely, a reversal rally from the $0.12 mark can drive the prices down to $0.10.
Read Also : Altseason is Here! Watch Out for These 2 Altcoins Set to Explode Soon


