MATIC Price Preps Trend Reversal With This Morning Star
Author: Sohrab Khawas 
Sohrab Khawas 
Author
Sohrab is a passionate cryptocurrency news writer with over five years of experience covering the industry. He keeps a keen interest in blockchain technology and its potential to revolutionize finance. Whether he's trading or writing, Sohrab always keeps his finger on the pulse of the crypto world, using his expertise to deliver informative and engaging articles that educate and inspire. When he's not analyzing the markets, Sohrab indulges in his hobbies of graphic design, minimal design or listening to his favorite hip-hop tunes.


Apr 26, 2024 15:27
Sohrab Khawas
Author
Sohrab is a passionate cryptocurrency news writer with over five years of experience covering the industry. He keeps a keen interest in blockchain technology and its potential to revolutionize finance. Whether he's trading or writing, Sohrab always keeps his finger on the pulse of the crypto world, using his expertise to deliver informative and engaging articles that educate and inspire. When he's not analyzing the markets, Sohrab indulges in his hobbies of graphic design, minimal design or listening to his favorite hip-hop tunes.
MATIC price trend shows a massive correction of 42% in the last six weeks.
The buyers create a stronghold at $0.70, teasing a morning star.
A bullish revival projects a potential bull run to $1 in May 2024.
Amidst the broader market crash, the MATIC price shows an intense correction phase as it reverses from a long-coming resistance trendline. The long-term trend in the Polygon continues with a lower high formation.
With hardly any bullish impact seen of the Bitcoin Halving, the MATIC price awaits an altcoin season recovery. Considering the uptrend momentum revives in Polygon, our MATIC price prediction projects a bullish 2024.
MATIC Price Performance
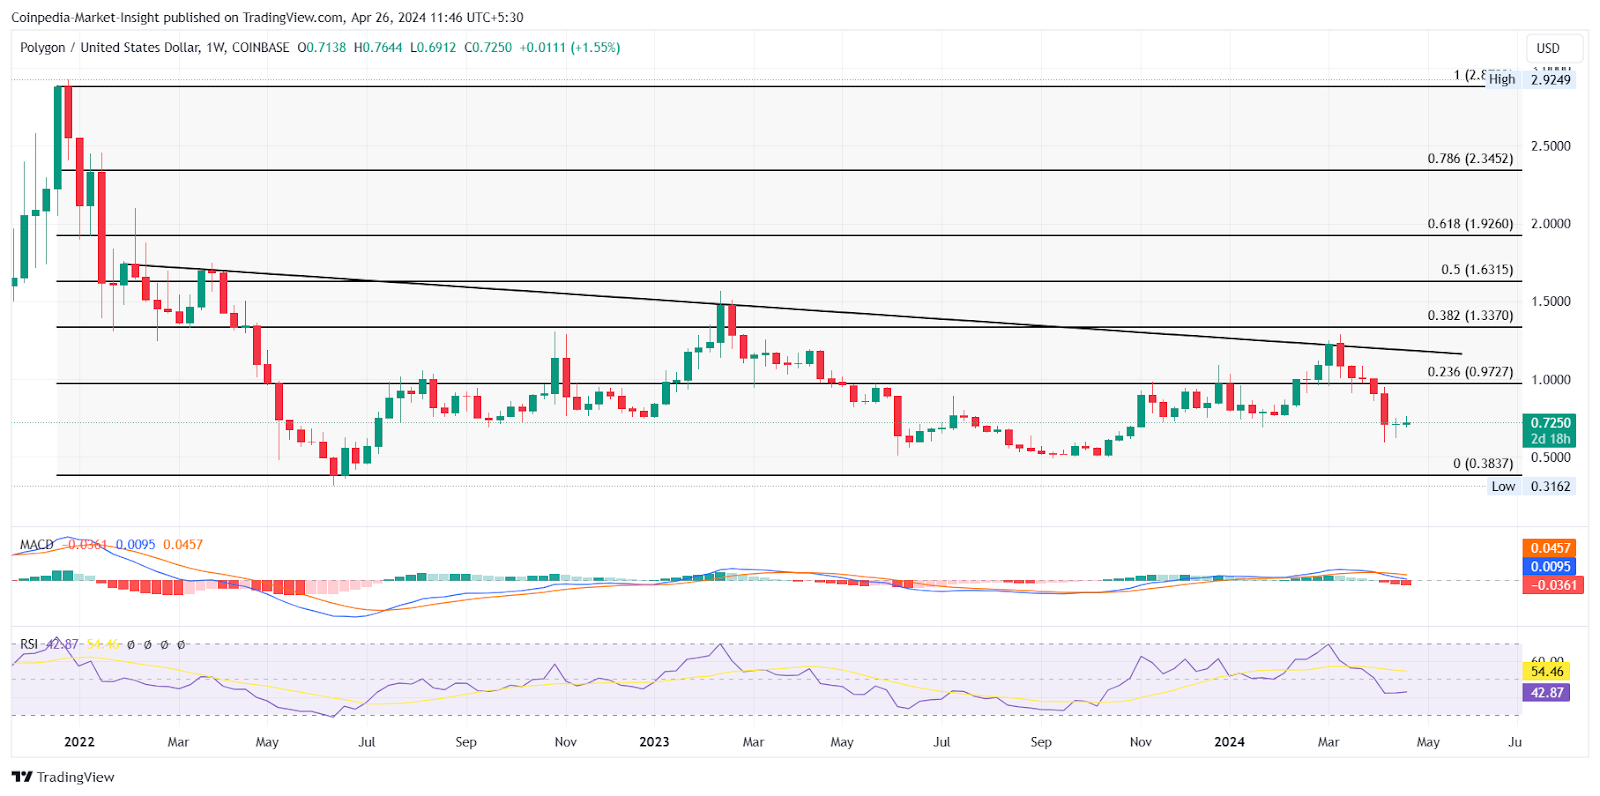
The MATIC price trend finally halts the consecutive bearish candle formation with a Doji candle formation at the $0.70 mark. Further, the weekly chart showcases a positive turnaround possibility with a potential morning star pattern.
With lower price rejection and a history of bullish reversals from the $0.70 mark, the uptrend could surpass the 23.60% Fibonacci level. This means another bullish attempt for the trendline breakout for an extended uptrend in 2024 is possible.
Currently, the MATIC price trades at $0.7183 with a minor intraday growth and a market cap of $7.10 Billion. As a top bluechip crypto and solid fundamentals, the underlying potential is commendable for Polygon.
Technical Indicators:
RSI: The weekly RSI line shows a bullish turnaround possibility as it stagnates under the halfway line.
MACD: The MACD and signal lines in the weekly chart give a bearish crossover and warn of a steeper correction. Hence, the momentum indicators are bearish but showcase a minor possibility of a reversal rally.
Will Polygon Regain Bullish Trend?
As the broader market gradually grows anxious about a quick recovery next week, the possibility of a bounce back in Polygon increases. Considering the uptrend restarts, the MATIC price could reach the $1.35 mark with the trendline breakout before taking on the $1.5 barrier.
On the downside, a break under $0.70 could prove fatal and drop the altcoin to the psychological mark of $0.50.