Fintech Radar
-

Thriving futures: The consumer benefits to Bank & Fintech partnerships
Anita Paju, Head of Customer Success at LHV, sheds light on the pivotal role European banking providers play, the significance of collaborating with fintechs, and the dynamic changes seen currently in the financial landscape at MPE 2024. We discuss payments infrastructure, the value of partnering with fintechs, and explore LVH’s future priorities aimed at enhancing infrastructure and broadening se...
-

A love for data jump started the career of Citizens' chief experience officer: The Climb
Beth Johnson, a self-described math geek, is driving the bank's ESG strategy and training its employees to keep pace with industry trends.
-

Credit Cards Fuel Big Banks’ Loan Growth Amid ‘Normalization’
Credit card lending boosts big banks' loan growth as consumer spending normalizes post-pandemic. What does this entail?
-

Will Bitcoin Peak Sooner? Analyst Unveils Two Potential Scenarios
The post Will Bitcoin Peak Sooner? Analyst Unveils Two Potential Scenarios appeared first on Coinpedia Fintech News Prominent crypto analyst Rekt Capital has delved into historical patterns to determine when Bitcoin might reach its peak in the current bull market. Drawing on historical patterns and the current state of the market, Rekt Capital offers intriguing projections that could shape investors’ strategies in the coming months. Decoding Bitcoin’s Bull Market Peak Rekt Capital sheds light on a fascinating trend: Bitcoin’s bull market tends to peak roughly 518-546 days after the halving event. This nugget of insight sets the stage for predicting when Bitcoin might hit its highest point. #BTCWhen Could Bitcoin Peak In This Bull Market?Historically, Bitcoin has peaked in its Bull Market 518-546 days after the Halving (Chart 1)This is how typical Bitcoin Halving Cycles have progressedSo if history repeats…Next Bull Market peak may occur 518-546 days… pic.twitter.com/QXZUS7ZyjU— Rekt Capital (@rektcapital) April 19, 2024 However, amidst this treasure trove of data, Rekt Capital sounds a note of caution. Despite historical patterns, the current cycle of Bitcoin is moving at a faster pace. Despite a recent dip before the halving, Bitcoin has surged to new heights a whopping 260 days earlier than expected. This faster rhythm adds an element of unpredictability to when Bitcoin might reach its peak in this bull market. A Fresh Perspective In response to the swift pace, Rekt Capital suggests a new way to predict Bitcoin’s peak. Instead of starting from the halving event, they propose beginning from when Bitcoin surpasses its previous all-time high. According to this approach, the peak could come 266-315 days later. This nuanced view gives a different angle on understanding Bitcoin’s journey. Bitcoin’s Future: Possible Scenarios Armed with these insights, Rekt Capital lays out two possible scenarios for Bitcoin’s peak in this bull market. If historical trends hold, we could see the peak around mid-September or mid-October 2025. Yet, in this fast-moving landscape, the peak could arrive sooner than expected, possibly between December 2024 and February 2025. Does Rekt Capital’s analysis resonate with your own market predictions?
-
The Juggling Act That Can Cost Middle-Market Firms $10 Million
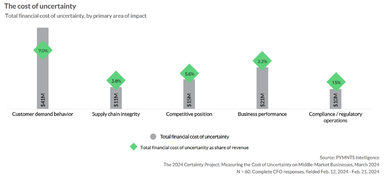
This week, an official with the Financial Conduct Authority (FCA), an agency tasked with overseeing firms and markets in the U.K., compared her job to that of a juggler. “Juggling is, at least metaphorically, a skill we regulators have to master,” said Sarah Pritchard, executive director, markets and international for the FCA. “Whether it is balancing the demands of consumers, markets or firms.” Pritchard shared her analogy with attendees of TheCityUK International Conference 2024, an event that brought together industry leaders, policymakers and regulators from across the United Kingdom. Included in the list of things she and her FCA colleagues must juggle, she said, is the need to encourage competition, advance operational objectives, support new technology and promote “responsible innovation”— all whole working to protect consumers and markets. That’s a lot of juggling — and it might explain why the roster publications available on the FCA’s website include directives about borrowing, mortgage protections, social media standards, auto loans, insurance distributions, crypto assets, corporate sustainability requirements and more. In other words, regulators in the U.K. — just like regulators in the U.S., Spain, Australia, and other countries — have a lot on their plate. Consider just what one U.S. agency, the Consumer Financial Protection Bureau (CFPB), must monitor: banks, thrifts, credit unions, non-depository mortgage originators and servicers; payday lenders; consumer reporting; debt collection; international money transfers, automobile financing and more. This extensive jurisdiction explains why the CFPB is now considering actions on online gaming, student loans, title insurance, credit card reward points and late fees, to name just a few. None of this is to suggest that the FCA, the CFPB or any of the other industry watchdog isn’t doing important work. However, it’s worth remembering that when any industry practice — questionable or otherwise — captures the attention of regulators, it can lead to greater uncertainty for those industries. And as PYMNTS Intelligence recently found, uncertainty can cost businesses, especially smaller ones, millions. In fact, according to CFOs surveyed for “The 2024 Certainty Project Report,” middle-market companies stand to lose roughly $20 million on average due to uncertainty and — and regulatory compliance is a major contributor to those losses. “The 2024 Certainty Project Report” — which draws from surveys we conducted with 60 chief financial officers (CFOs) of companies that had annual revenues between $100 million and $1 billion last year, and which will spotlight other decision-makers in future editions — zeroed in the toll uncertainty takes on middle-market companies. A reason for this focus: we found larger companies operate with a greater sense of certainty. CFOs at larger middle-market firms tell PYMNTS Intelligence that they have the resources needed to navigate market ups and downs, which is why 57% say they operate with high levels of certainty. But smaller middle-market companies have to perform a far more demanding highwire act when negotiating uncertainty. Forty-seven percent of CFOs from smaller firms deal with considerable uncertainty, which is more than double the 21% faced by CFOs operating in the largest revenue bracket studied: $750 million to $1 billion. Overall, middle-market companies lose about 4.4% of their annual revenues due to uncertainty. Over a 12-month period, smaller companies lose, on average, $21 million due to uncertainty, according to the CFOs we surveyed. As the accompanying graphic illustrates, these CFOs cite a variety of factors that drove uncertainty in the last 12 months. For middle-market firms that identified shifting customer demand behavior as the primary driver of uncertainty, uncertainty cost 7% of revenue: approximately $41 million. If uncertain business performance was the lead issue, $21 million was lost on average. And when compliance and regulatory uncertainty was the top issue, middle-market CFOs said uncertainty cost them $10 million on average. While no one is denying regulators have a lot of plates in the air as they work to manage the many industries and organizations placed under their jurisdiction, it’s worth remembering that middle-markets firms are also performing juggling acts as they work to stay afloat. Keeping pace with changing regulatory requirements can make it even tougher to find the right kind of balance. The post The Juggling Act That Can Cost Middle-Market Firms $10 Million appeared first on PYMNTS.com.
-

Telegram’s Toncoin Outshines Legacy Networks and Meme Coins
The post Telegram’s Toncoin Outshines Legacy Networks and Meme Coins appeared first on Coinpedia Fintech News Big changes are happening in the world of layer one (L1) networks, thanks to the rising star of the Telegram-backed Toncoin (TON) blockchain. Toncoin recently knocked Cardano (ADA) out of the top ten digital assets and now, it’s overtaking Dogecoin (DOGE), a favorite of tech tycoon Elon Musk. Toncoin’s rise has been impressive. As of Friday, it’s valued at around $32 billion fully diluted, with a market cap of about $22 billion. Dogecoin, on the other hand, lacks support for web3 smart contracts and trails behind at approximately $21.9 billion in value. What Has Made the Toncoin Network Tick? With backing from Telegram and its massive user base of over 200 million daily active users (DAU), Toncoin had a head start. Plus, it secured over $1.7 billion in funding from top-notch venture capitalists like DWL Labs, setting it on a path to success. Toncoin’s ecosystem is thriving, with about $164 million locked in various projects like the Notcoin (NOT) meme coin. Tether’s recent announcement of integrating its tokens USDT and XAUT into the Toncoin network further solidifies its position. Toncoin vs Ethereum? Toncoin’s ecosystem is shaping up to rival Ethereum’s, attracting a diverse range of web3 projects and promising fierce competition. Toncoin Price Analysis Despite its success, Toncoin’s price has been stuck in a consolidation phase, similar to other altcoins. Analysts foresee potential corrections in the coming months, with support likely at the $5 mark. Tether Tokens (USD₮ and XAU₮) Launch on The Open Network (TON) @ton_blockchainhttps://t.co/TwYhMeHAZ5— Tether (@Tether_to) April 19, 2024 The weekly Relative Strength Index (RSI) hints at challenges ahead, suggesting caution despite the overall market optimism. With strong backing and a growing ecosystem, Toncoin is poised to shape the future of decentralized finance (DeFi) and blockchain technology.
-

Ethena (ENA) & THORChain (RUNE) Price Record Massive Gains; Here’s Where They May Reach This Week
The post Ethena (ENA) & THORChain (RUNE) Price Record Massive Gains; Here’s Where They May Reach This Week appeared first on Coinpedia Fintech News Ethena (ENA) Price Analysis Ethena, an Ethereum-based synthetic dollar protocol, has triggered a bullish breakout beyond the resistance. One of the main reasons behind the surge is anticipated to be followed by a collaboration with Bitget Wallet. This enables users to engage with Ethena via Bitget’s wallet browser extension and mobile application. The users will also receive an airdrop of BWB points if they have deposited at least 100 USDT on Ethena. Having said that, will ENA price maintain a bullish trend? In the short term, the ENA price has broken the bearish pattern, breaking through the descending trend line. The RSI has been soaring and has reached average levels, which has lifted the levels close to the upper targets. In the coming days, the price is believed to maintain an ascending consolidation and eventually reach the crucial resistance zone between $1.19 and $1.2, probably by the end of the week. THORChain (RUNE) Price Analysis THORChain has been stuck within a bearish trend for over a year and formed lows around $0.8. Further, the price triggered a healthy upswing before the markets began to rise in the last quarter of 2023. Since then, the price has been maintaining a healthy upswing and marked highs above $10, which lasted only for a day. However, the rally continues to flash a massive bullish signal as the bulls are trying to hold above the crucial support and push the price within the bullish range. As seen in the above chart, the RUNE price is trading within a rising, expanding channel, and the latest bearish pressure has compelled the price to plunge below the support. However, the volume is in a bullish direction, due to which the price may maintain a bullish trend for some time ahead. The RSI also has displayed a bullish divergence, due to which the trend is expected to remain elevated, reclaim the lost levels within the bullish range and secure levels within the key resistance zone above $7
-

Project Nemo: Pioneering Disability Inclusion in Fintech
Live at IFGS 2024, Joanne Dewar, Project Lead at Project Nemo, discusses Project Nemo’s innovative initiative driving disability inclusion in fintech. With one in five individuals having disabilities, this project connects fintech firms with specialized service providers to promote awareness and change. We discuss upcoming workshops and events aimed at providing practical resources for inclusion e...


